Rising Regional Rates

Getting a foot on the property ladder was once a rite of passage for people in the UK. Having your own home was an attainable aspiration for anyone in full-time employment, with average house prices in 1970 just 3.89 times the average salary.
However, these days, owning your own home is a much more daunting financial prospect, and rapidly increasing bills means keeping the house warm and the lights on is more expensive than it has ever been before.
In addition to struggling with heating and electricity bills, the ongoing cost of living crisis has seen everyday expenses increase dramatically, from the cost of weekly groceries to filling up your car. Combine this with low wage growth and spiralling interest rates, and the average person could be in a difficult financial position.
With all this in mind, we wanted to explore just how much the average cost of housing and utilities has risen over the last decade. We're also interested to uncover whether the gap between house prices and annual wages has increased, and by how much, in different parts of the country. This should allow us to reveal the parts of the UK that are the most and least affordable for residents.
Residential property affordability in 2022
We've looked at the average annual salary in each local authority area in England, Wales and Scotland, and compared it with the average house prices in those areas. Using that data, we have calculated a salary-price ratio for each location which shows how many years' salary the average property is worth.
Least affordable locations to buy

Camden, London
Salary-Price Ratio: 17.583
Camden is the UK area with the least-affordable housing for residents, with average house price coming in at 17.583 times that of the average annual salary. As an inner London borough, Camden was always going to have some of the most expensive housing in the country, especially as it is a popular destination for tourists and Londoners thanks to its famous market, bars and venues. While local annual salaries are £15,305 higher than the national average, the average house price in the area is £856,416, making the prospect of buying in the area a distant one for local workers.
Westminster, London
Salary-Price Ratio: 17.195
Westminster has the second highest salary-price ratio in the country, with house prices sitting at 17.195 times the local average annual salary of £56,763. Another central London borough, Westminster is home to the heart of the UK government and understandably has some of the highest property prices in the country, though this means the average house price stood at a huge £976,041.
Hertsmere, East of England
Salary-Price Ratio: 16.492
Hertsmere, in Hertfordshire in the East of England, is the third-least affordable place to buy a house in the country, with a salary-price ratio of 16.492. Sitting on the border of North London, Hertsmere falls within the London commuter belt with towns such as Bushey, Potters Bar and Borehamwood being popular locations. The average house price here is £529,794, just less than twice the national average, while the average annual salary is just below the national average at £32,125.
Most affordable locations to buy
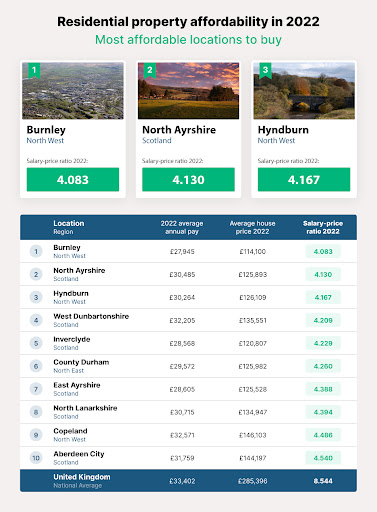
Burnley, North West
Salary-Price Ratio: 4.083
Burnley is the location with the most affordable housing in the UK, with a salary-price ratio of 4.083. This Lancashire mill town has the cheapest average house price in the country at £114,100, while the average annual salary in 2022 was £27,945. Burnley is a town with a rich history that has unfortunately been hard-hit by the decline in British manufacturing, which is at least part of the reason why house prices have not risen at the same rate as other UK areas.
North Ayrshire, Scotland
Salary-Price Ratio: 4.130
North Ayrshire is a largely rural area of Scotland to the west of Glasgow which includes the Isle of Arran. This is the second most affordable part of the UK for locals to get on the housing ladder with a salary-price ratio of 4.130. Property prices in North Ayrshire are the fourth lowest in the country at £125,893, while local annual salaries are approximately £3,000 below the national average at £30,585.
Hyndburn, North West
Salary-Price Ratio: 4.167
Hyndburn is the third most affordable place for locals to buy a house in the UK with a salary-price ratio of 4.167. This area of Lancashire is situated between Burnley and Blackburn and is home to a mix of rural and post-industrial towns such as Accrington, Great Harwood and Oswaldtwistle. The average house price in Hyndburn was £126,109 in 2022, while the average salary was £30,264.
Housing affordability by region
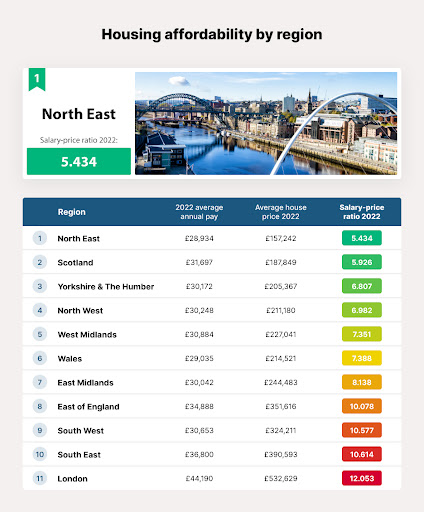
Here we can see the average annual salary and house price in each region, as well as their overall salary-price ratio. Unsurprisingly, London is the least affordable region with a salary-price ratio of 12.053, while the North East is the most affordable with a ratio of just 5.434.
The region with the highest average house price is London, where it stands at £532,629, and the lowest average price can be found in the North East at £157,242. Outside of London, the area with the highest average house price is the South East at £390,593.
House Prices: 10-year change
House prices in the UK are often scrutinised as being far too high for young people to comfortably get on the housing ladder. However, this has only gotten worse over time, so we wanted to reveal which UK locations have seen the biggest rise in property prices over the last decade.
Areas with the biggest increase in house prices

Waltham Forest, London
10-Year Price Change: 116.68%
Waltham Forest has seen the biggest rise in house prices over the last decade, with an increase of 116.68%. This northeast London borough is home to the bustling town of Walthamstow, home to the longest outdoor market in Europe which measures approximately 1 kilometre in length. In 2012, the average house price in Waltham Forest was £230,727 but has since more than doubled to stand at £499,946 in 2022.
Thanet, South East
10-Year Price Change: 112.35%
Thanet has seen the second-largest 10-year increase in property prices at 112.35%. This area on the northeastern tip of Kent is a popular destination for seaside visits, especially the town of Margate which is home to the recently reopened Dreamland amusement park. Average house prices in Thanet have soared in the last decade, rising from £145,135 in 2012 to £308,193 in 2022.
Barking and Dagenham, London
10-Year Price Change: 108.56%
Barking and Dagenham is the part of the UK with the third biggest increase in average house prices at 108.56%. Despite prices rising so quickly in this East London borough, it remains the cheapest place in London to purchase property with an average price of £345,924. However, the area also has the lowest average annual salary in the capital at £30,006, one of only two London boroughs where this figure is lower than the national average.
Areas with falling house prices and the lowest increases
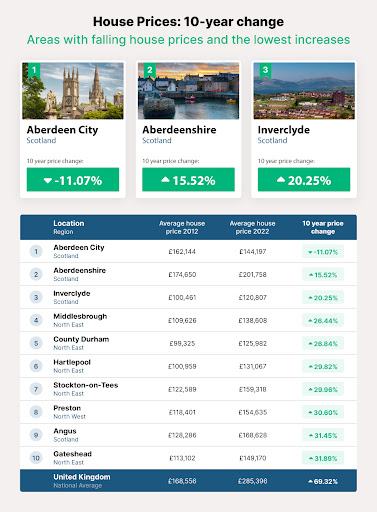
Aberdeen City, Scotland
10-Year Price Change: -11.07%
The city of Aberdeen in Scotland is the only area of the UK where average house prices have actually fallen over the last ten years, with a decrease of 11.07%. In 2012, the average house price in the city was £162,144, which now stands at £144,197 as of 2022. While this fall in prices is bound to delight prospective buyers in the area, homeowners could find it difficult to accept offers lower than what they paid in the first place.
Aberdeenshire, Scotland
10-Year Price Change: 15.52%
The area with the lowest increase in house prices over the last decade, excluding where prices actually fell, is Aberdeenshire, a large area of northeastern Scotland home to towns such as Fraserburgh, Peterhead and Stonehaven, as well as part of the Cairngorms National Park. Prices here have risen by just 15.52% over the last 10 years, a fact which is inevitably tied to the lack of house price inflation in neighbouring Aberdeen.
Inverclyde, Scotland
10-Year Price Change: 20.25%
In third place, with a 10-year price increase of 20.25%, is Inverclyde. Inverclyde is an area to the west of Glasgow which sits at the mouth of the River Clyde. The largest town in the area is Greenock, which is joined to Gourock to the northwest and Port Glasgow to the east. The average house price in Inverclyde was £100,461 in 2012 and stands at £120,807 as of 2022.
10-year house price changes by region

The region with the biggest increase in house prices over the last decade is the East of England, where the average price rose from £193,628 in 2012 to £351,616 in 2022 for a total increase of 81.59%
The smallest increase was seen in the North East, where average prices rose by just 35.15% from £116,344 to £157,242 in 2022.
Residential property affordability: 10-year change
Using annual salary data and average house prices from 2012, we've compared the salary-price ratio in 2022 to that a decade earlier. This will reveal which parts of the UK have decreased in affordability the most over the last 10 years, and which, if any, have become more affordable.
Areas where housing is becoming less affordable
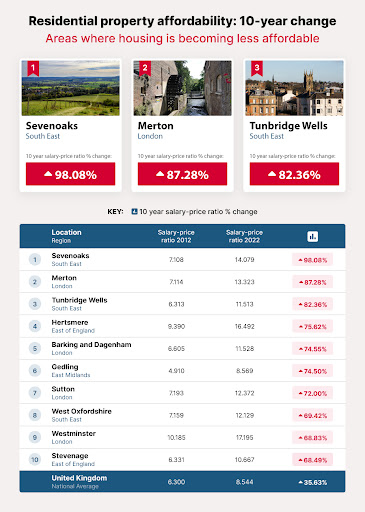
Sevenoaks, South East
10yr Salary-Price Ratio, % Change: 98.08%
Sevenoaks is the UK location which has seen the biggest increase in its salary-price ratio in the last 10 years, meaning it is becoming less affordable the quickest. In 2012, the salary-price ratio in the town was 7.108, though this has risen to 14.079 in 2022, an increase of 98.08%. Sevenoaks is a popular commuter town in Kent which is served by a direct rail link to central London, which is doubtless a key factor in why it is becoming so much more unaffordable for locals.
Merton, London
10yr Salary-Price Ratio, % Change: 87.28%
Merton, a southwest London borough in which you can find Wimbledon, Raynes Park, Mitcham and Morden, has seen the second highest 10-year increase to its salary-price ratio at 87.28%. In 2012, the salary-price ratio was 7.114 but in 2022 that figure reached 13.323, meaning the area is quickly becoming too expensive for locals to buy in.
Tunbridge Wells, South East
10yr Salary-Price Ratio, % Change: 82.36%
Tunbridge Wells has seen the third highest increase in its salary-price ratio at 82.36%. Tunbridge Wells is a popular location for families moving out of London for a slower pace of life and is regarded as one of the country's most affluent and least-deprived areas. Despite this relative success, Tunbridge Wells is quickly becoming unaffordable for people who work locally, as the average house price rose by 70.13% in the last decade while average annual salaries fell by 6.71%.
Areas where housing is becoming more affordable

Aberdeen City, Scotland
10yr Salary-Price Ratio, % Change: -18.09%
The city of Aberdeen is seeing the fastest increase in affordability in the country, as the area's salary-price ratio has fallen by 18.09% in the last decade. The average house price in the city has fallen by 11.07% since 2012, but average salaries in Aberdeen have risen by 8.57% from £29,252 in 2012 to £31,759 in 2022.
Allerdale, North West
10yr Salary-Price Ratio, % Change: -9.03%
Allerdale is another UK location where housing is becoming more affordable for local residents, with the second biggest decrease in the salary-price ratio of 9.03%. This remote part of North West England encompasses the northern part of the Lake District and reaches as far as the Esk estuary. House prices have risen by 32.17% in Allerdale since 2012, while the average annual salary in the area has increased by 45.30%, making the area much more affordable for locals. Some of the larger towns in the area are Kendal, Cockermouth and Workington.
Darlington, North East
10yr Salary-Price Ratio, % Change: -8.97%
The town of Darlington in County Durham in the North East has the third biggest drop in its salary-price ratio with a decrease of 8.97%. The average house price in Darlington has risen by 32.95% since 2012, which is substantially lower than the 46.05% increase in average salary, meaning that locals will be more able to afford property in the town than they were 10 years ago.
Changes in housing affordability by UK region
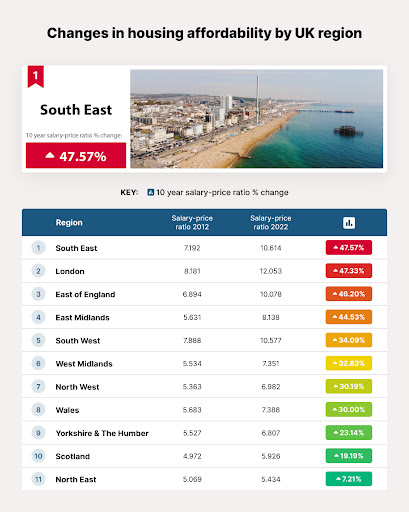
The South East is the UK region which has seen the largest rise in its salary-price ratio in the last 10 years, with an increase of 47.57%, meaning it is becoming unaffordable for locals at the fastest rate. This is closely followed by London with a salary-price ratio increase of 47.33%, the East of England with an increase of 46.20%, and the East Midlands, where this figure has risen by 44.53% since 2012.
The North East has seen the smallest rise in unaffordability, with the local salary-price ratio only increasing by 7.21%. This is by far the lowest increase in the country, with Scotland seeing the second-lowest rise of 19.19%.
Energy bills: gas and electricity prices in the UK
Having looked at how the affordability of housing can vary in different parts of the country, we also wanted to consider the differing cost of bills. In this section, we have calculated the average cost of gas and electricity bills in different UK regions. We did this by multiplying the average number of units used by the average cost per unit in each location and then adding that figure to the average standing charge.
Average energy bills by UK region 2022
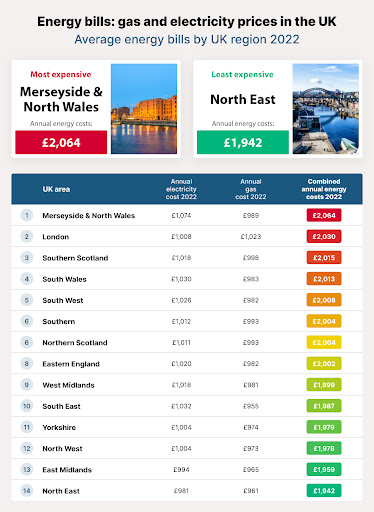
Most Expensive: Merseyside & North Wales Annual Energy Costs: £2,064
The most expensive UK region for energy bills is Merseyside and North Wales, with combined annual energy costs of £2,064 per household, £1,074 of which was for electricity with the remaining £989 paying for gas. London was the region with the second-highest combined annual energy bill of £2,030 per household on average, though it has the highest average gas bill of £1,023 per household.
Least Expensive: North East Annual Energy Costs: £1,942
The North East is the region with the lowest average combined energy costs in 2022 with an annual bill of £1,942 per household. The North East saw the lowest spending on both forms of energy, with the region's combined figure made up of a £981 electricity bill and a £961 gas bill.
UK energy bills: 10-year change
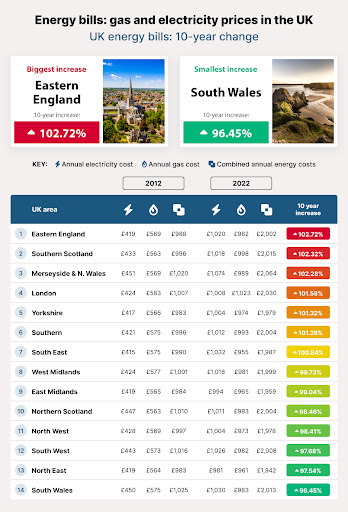
Biggest 10-Year Increase: Eastern England
The Eastern England region saw the biggest increase in energy bills over the last 10 years, with the average annual cost rising by 102.72% from £988 in 2012 to £2,002 in 2022. Electricity made up the biggest proportion of this increase, more than doubling from £419 in 2012 to £1,020 in 2022, which is more than the combined bill 10 years earlier!
Smallest 10-Year Increase: South Wales
South Wales had the smallest increase in energy bills over the last decade, though it was still a substantial rise of 96.45%, with combined prices going up from £1,025 in 2012 to £2,013 in 2022. However, the North East is the region with the lowest energy bills in 2022, with a combined cost of £1,942.
UK water bills
In addition to energy bills, running a home uses plenty of water throughout the year which adds further pressure to the cost of living. While water bills are usually much lower than gas and electric, water rates can vary substantially between providers. However, residential customers are currently unable to choose their water supplier and have to use whichever company services the area in which they live.
In this section, we will reveal the water suppliers with the lowest annual bills, as well as those with the largest annual increase in rates.
Current annual household water bills by supplier

The most expensive water companies
Wessex
Average Annual Water Bill: £261
The most expensive water company in the UK is Wessex Water, with an average annual bill of £261. Wessex Water services approximately 10,000 square miles of southwest England including Bristol and large parts of Dorset, Somerset and Wiltshire.
Essex and Suffolk
Average Annual Water Bill: £259
The second most expensive UK water company is Essex and Suffolk Water, with an average annual water bill of £259. As the name suggests, the company services much of the East of England including Essex and Suffolk as well as parts of Norfolk and Greater London.
Thames
Average Annual Water Bill: £258
Thames Water is the third most expensive water company in the UK, with an average annual bill of £258. As the largest water company in the country, Thames Water services a huge area including most of Greater London, the Thames Valley, Surrey and Gloucestershire, as well as several other parts of the country.
The cheapest water companies
Portsmouth
Average Annual Water Bill: £117
The cheapest water company in the country is Portsmouth Water, with an average annual bill of £117, which is less than half the amount of any of the most expensive companies. Portsmouth Water services the City of Portsmouth as well as parts of East Hampshire and West Sussex including Chichester, Bognor Regis, Gosport and Fareham.
Bournemouth
Average Annual Water Bill: £140
Bournemouth Water is the second most affordable water company in the UK, with average annual bills of £140. Bournemouth Water covers a large area of southern England including Poole, Salisbury and Bournemouth itself.
Cambridge
Average Annual Water Bill: £161
The third cheapest water supplier in the UK is the Cambridge Water Company, with average annual bills of £161. Cambridge Water just serves Cambridge and the surrounding area and does not supply wastewater services which are instead provided by Anglian Water.
Annual price increases by UK water supplier
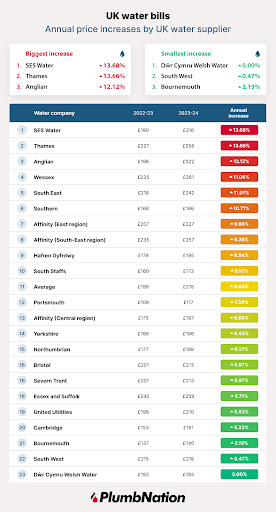
Companies with the biggest annual increase
SES Water
Annual Water Bill Increase: 13.68%
SES Water is the water supplier with the biggest annual increase in average bills at 13.68%, rising from £190 to £216. SES Water is based in Redhill, Surrey, and services several parts of the South East including east Surrey, West Sussex, west Kent, and south London.
Thames
Annual Water Bill Increase: 13.66%
Thames Water had the second-highest annual increase in average bills, with a rise of 13.66%. This saw bills go up from an average of £227 to £258, making Thames Water the third most expensive water company in the UK.
Anglian
Annual Water Bill Increase: 12.12%
Anglian Water has the third highest annual price increase of 12.12%, with bills rising from an average of £198 to £222 per year. Anglian Water provides its services to large parts of eastern and central England including Bedfordshire, Buckinghamshire, Cambridgeshire, Lincolnshire, Nottinghamshire and Norfolk.
Companies with the smallest annual increase
Dŵr Cymru Welsh Water
Annual Water Bill Increase: 0.00%
Cymru Welsh Water is the UK water company with the smallest increase in annual bills as their prices have stayed the same. This means that bill-payers in Wales can look forward to the same relatively low water rates they enjoyed last year with average bills of £193.
South West
Annual Water Bill Increase: 0.47%
South West Water has the second lowest annual increase in prices of just 0.47%, rising from an average of £215 to £216. South West Water provides water services in Devon and Cornwall, as well as parts of Dorset and Somerset.
Bournemouth
Annual Water Bill Increase: 2.19%
Bournemouth Water has seen the third-lowest annual increase in average bills of 2.19%, going from £137 to £140. This very small increase is why households in the Bournemouth area can enjoy the third-lowest water rates in the country.
Methodology
We wanted to reveal which parts of the country have seen the biggest changes in regional prices across housing and household bills. To do this, created a list of local authority areas in the UK and compared them against one another.
We used data ONS data to reveal the average pay in each local authority area in 2022 and combined it with data from the UK House Price Index showing the average 2022 house price in each location. We were then able to calculate a salary-price ratio showing how many annual salaries the average house costs in each local authority area. The smaller the ratio, the more affordable the area, and vice-versa.
We then repeated this process for 2012 data and compared the results between the two years. This allowed us to see where house prices and salaries have risen or fallen across the country, and calculate changes to the salary-price ratio over the past decade. This reveals which areas are becoming more or less affordable for residents.
Complete data for Northern Ireland and a handful of local authorities was not available, so these were not included in the analysis.
Additionally, we wanted to compare how household bills have changed in different parts of the country over the past decade. We used government data from the Department for Business, Energy and Industrial Strategy (BEIS) to reveal the average gas and electricity bills in each region. We multiplied the average cost of a unit of electricity and gas in each region with the typical household usage of each fuel source as published by Ofgem. We then added these figures to the average standing charges for gas and electricity in each region, taken from the BEIS data, to reveal the total combined cost of fuel bills in each area. This process was done for both 2022 data and 2012 data, allowing us to see how bills have changed across the country over the last 10 years.
We also considered the cost of water bills in different parts of the country, using data from Discover Water which showed us the annual cost of water bills split by supplier. We revealed the water companies with the most and least expensive average annual bills for 2023/34 and compared this to the figures for 2022/23 to calculate average increases.